Greenwich Emerges as London’s Property Hotspot, Average House Prices Soar
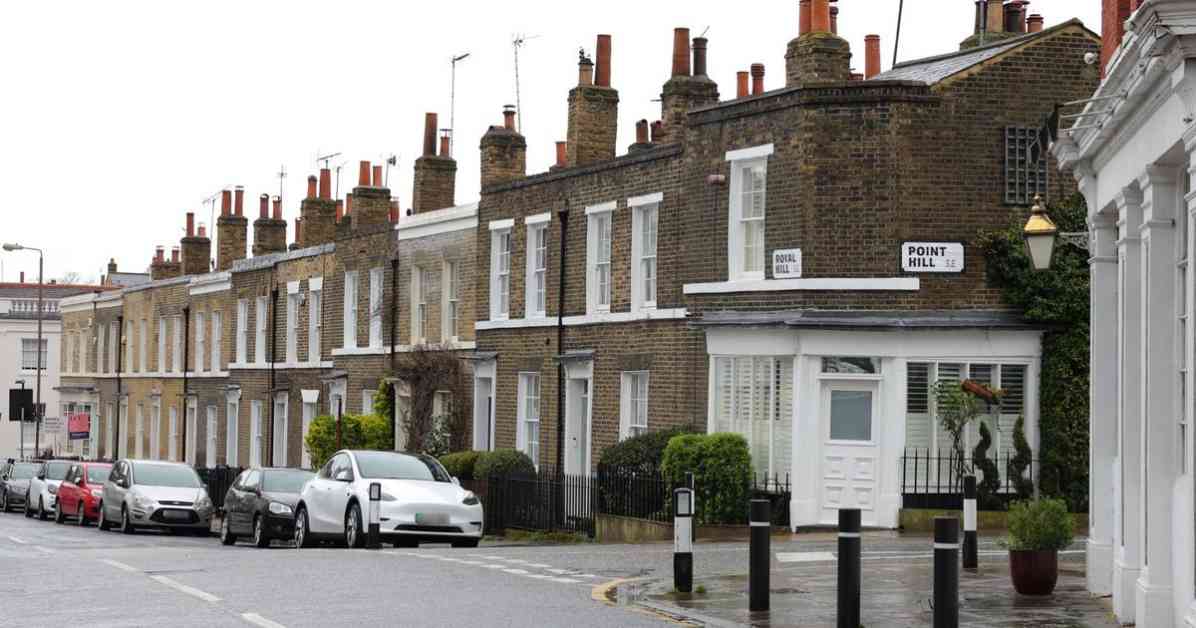
In the ever-evolving landscape of London’s real estate market, Greenwich has emerged as the latest property hotspot, with average house prices skyrocketing by nearly £40,000 over the past year. According to the latest data from the Land Registry, the average cost of purchasing a home in Greenwich stood at £486,000 in the 12 months leading up to December 2024. This represents an 8.8% increase from the previous year, translating to an additional £39,300 per house sold and marking the largest percentage surge in London.
London’s Property Market Landscape
While Greenwich steals the spotlight with its impressive growth, other London boroughs have also witnessed notable increases in house prices. Redbridge leads the pack with a 6.6% rise, followed closely by Sutton at 6.2%, Lewisham at 5.8%, and Waltham Forest at 5.2%. However, not all areas experienced such positive growth, with 11 London boroughs either lagging behind the national average increase of 4.6% or seeing a decline in prices. Notably, Kensington and Chelsea saw the biggest drop in the country, with average home prices plummeting by 22.9% to £1.07 million in the year leading up to December 2024.
National Property Hotspots
Zooming out to a national scale, Blackburn with Darwen emerges as the property hotspot of 2024, with average home prices seeing a 13.1% surge from the previous year, reaching £159,000. This upward trend was also observed in Lisburn and Castlereagh, Inverclyde, Fermanagh and Omagh, and Tewkesbury, with percentage increases ranging from 11.0% to 11.4%.
Diving Deeper into the Data
To get a clearer picture of the fluctuations in house prices across London, let’s break down the percentage increases in various boroughs:
London Boroughs House Price Percentage Increases
– Greenwich: 8.8%
– Redbridge: 6.6%
– Sutton: 6.2%
– Lewisham: 5.8%
– Waltham Forest: 5.2%
– Havering: 4.5%
– Brent: 4.2%
– Hillingdon: 3.9%
– Tower Hamlets: 3.9%
– Bromley: 3.9%
– Barking and Dagenham: 3.4%
– Croydon: 3.4%
– Merton: 3%
– Bexley: 2.9%
– Hounslow: 2.6%
– Harrow: 2.3%
– Ealing: 2.2%
– Southwark: 1.4%
– Kingston upon Thames: 1.2%
– Enfield: 1.1%
– Barnet: 0.3%
– Haringey: 0.1%
– Newham: -0.5%
– City of London: -0.5%
– Richmond upon Thames: -0.6%
– Camden: -0.9%
– Lambeth: -1.4%
– Hackney: -4.2%
– Islington: -5.8%
– Wandsworth: -6.9%
– Hammersmith and Fulham: -10.5%
– City of Westminster: -22.2%
– Kensington and Chelsea: -22.9%
Average house prices in London also vary significantly across boroughs, with Kensington and Chelsea taking the lead at £1,070,000, followed by City of Westminster at £868,000 and Camden at £831,000. At the other end of the spectrum, Barking and Dagenham boasts the lowest average house price at £356,000.
The ever-changing real estate market continues to surprise and challenge both buyers and sellers, with each borough offering a unique snapshot of the larger property landscape. As we navigate these fluctuations, it’s essential to stay informed and adapt to the evolving market dynamics to make well-informed decisions.
Subscribe to our daily newsletters for the latest updates from across London and stay ahead of the curve in this dynamic property market.


